Individual Stats
This section compares the distribution of individual stats between 4d6-drop-lowest, Goblin’s caterpillar method, and the Improved Caterpillar method. I find that using each method, the distribution of possible individual stats is the same under each method. This both corroborates what Goblin found, and verifies that the Improved Caterpillar method continues to be consistent with 4d6-drop-lowest (looking at individual stats).
Simulations
To perform this, I ran a simulation of 100,000 characters, each with 6 stats each, producing 600,000 stats. The distribution of these results is visible below.
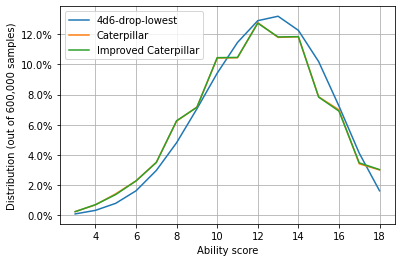
The two caterpillar methods (yellow and green lines, the yellow line is underneath the green line) have a very similar shape. Meanwhile, 4d6-drop-lowest (blue) has a smoother curve than the caterpillar methods, and has a slightly larger range of scores. However, overall the three distributions appear fairly similar.
Summary Statistics
This similarity can also be seen by looking at some summary statistics of the three methods.
| 4d6-drop-lowest | Caterpillar | Improved Caterpillar | |
|---|---|---|---|
| count | 600000.0 | 600000.0 | 600000.0 |
| mean | 12.2 | 12.0 | 12.0 |
| std | 2.85 | 3.09 | 3.09 |
| min | 3.0 | 3.0 | 3.0 |
| 25% | 10.0 | 10.0 | 10.0 |
| 50% | 12.0 | 12.0 | 12.0 |
| 75% | 14.0 | 14.0 | 14.0 |
| max | 18.0 | 18.0 | 18.0 |
The three methods have very similar means and standard deviations (std). Also for all methods, 25% of stats are 10 or lower, and 25% are 14 or higher. This reinforces the view that the distributions are very similar.
Conclusion
This section demonstrates that the three methods of stat generation have a similar distribution when looking at individual stats.
This begs the question, why bother with the more complex-to-follow caterpillar methods? The next section considers how strong characters are, which does vary between stat generation methods.