Stat Arrays
The caterpillar methods are supposed to reduce the chance of players have very high or very low stats. Players having very high or low stats can be undesirable as it makes some characters much more powerful than others, and can make it for hard for a DM to balance encounters. This section shows that Goblin’s caterpillar method does not achieve this goal. However, the Improved Caterpillar method does.
What is too much volatility?
People have different standards about what is an “acceptable” amount of volatility between characters. Some parties are happy to have one player with many scores of 15 or higher, and another player with only one score above 15 and every other stat below 12. For others, this difference would seem too large and would make the game less fun.
There’s no right answer here. In my opinion, the volatility of 4d6-drop-lowest is a bit too large, and I would prefer something closer to the Improved Caterpillar method. However, it is possible to reduce the volatility of character stat arrays even further, for example 13th Age’s Base 13 Random method. Some may consider this an even stronger improvement above Improved Caterpillar, while others may say it reduces the volatility too much.
How Can We Compare Stat Arrays?
When comparing stat arrays, it is helpful to reduce the six ability scores to a single number representing how good the roll is. One simple way to do this would be to just add up the six scores.
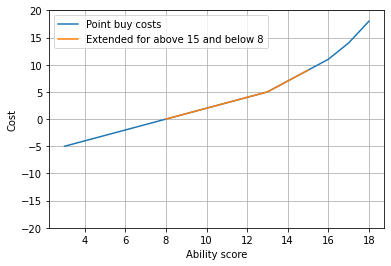
However, I consider an ability score of 18 relative to 16 to be much better than an ability score of 12 relative to 10. The former will probably increase your primary ability score and thus be used much more, while the latter may only have a small impact as it is probably not your character’s primary focus.
This is also reflected in the point buy method, which has a supralinear relationship for scores of 14+. For those interested this is outlined more here. Given this seems like a popular method of stat array generation, I have decided to adopt the costs for each ability score from this method. Because the point buy table only covers scores between 8 and 15, I have extended the table per the following schedule.
Simulations
We can now convert our stat arrays to a single “point buy budget” by calculating how much of each of the six ability scores would cost. The sum of these six costs is the total budget required for the character, and a higher budget indicates a more powerful character. The distribution of results is shown below.
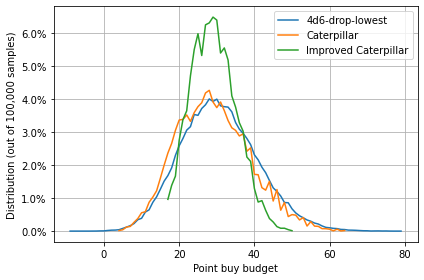
Both 4d6-drop-lowest and the original caterpillar method have a similar spread of characters. however, the Improved Caterpillar method has a much narrower range of possible budgets, indicating that it is much less likely to have a character which is much stronger or weaker than other characters in the same party.
Summary Statistics
We can again look at the summary statistics of the three stat generation methods, as shown in the table below.
| 4d6-drop-lowest | Caterpillar | Improved Caterpillar | |
|---|---|---|---|
| count | 100000.0 | 100000.0 | 100000.0 |
| mean | 30.7 | 29.1 | 29.1 |
| std | 10.2 | 9.76 | 5.96 |
| min | -9.0 | 4.0 | 17.0 |
| 25% | 24.0 | 22.0 | 25.0 |
| 50% | 30.0 | 28.0 | 29.0 |
| 75% | 37.0 | 36.0 | 33.0 |
| max | 79.0 | 66.0 | 50.0 |
We see that the average budget is between 29 to 31. This is slightly higher than the budget normally used by point buy (27). Others have already noted that 4d6-drop-lowest is expected to produce a higher budget than point buy. This now confirms that the caterpillar methods also expect to produce a better result than point-buy, albeit slightly lower than 4d6-drop-lowest.
The key difference is the difference in the spread (represented by the standard deviation, or std). 4d6-drop-lowest has the highest standard deviation of 10.1, while Goblin’s Caterpillar method has a slightly lower standard deviation of 9.7. However, Improved Caterpillar has a much lower standard deviation of 6.0, which again confirms that this method is less likely to produce much stronger or weaker characters.
Scenario Analysis
A more intuitive way to try to understand character variation is through considering some scenarios. I’ve calculated the probability of four different scenarios occurring under the three different stat generation methods. The first two represent the chance of rolling a character with “high” stats, and the second two rolling a character with “low” stats.
Characters with 2+ stats above 15 and only 0 or 1 stat below 10
Characters with 3+ stats above 13 and only 0 or 1 stat below 10
Characters with 3+ stats below 10 and only 0 or 1 stat above 15
Characters with 2+ stats below 10 and only 0 or 1 stat above 13
| 4d6-drop-lowest | Caterpillar | Improved Caterpillar | |
|---|---|---|---|
| Scenario 1 | 14.7% | 14.3% | 5.8% |
| Scenario 2 | 31.0% | 25.6% | 15.9% |
| Scenario 3 | 6.8% | 7.4% | 0.8% |
| Scenario 4 | 13.8% | 17.5% | 9.8% |
We can see that in each of the scenarios, these types of “extreme” characters are much more likely on 4d6-drop-lowest or original Caterpillar, compared to the Improved Caterpillar.
Comparing Correlation
Finally, we can look at the pair-wise correlation between each stat. This is a measure which indicates how “similar” stats are. For those unfamiliar with correlation:
A correlation of “1” between the first and second stat would indicate that whenever the first stat is high, the second stat will be high.
A correlation of “-1” means the opposite: whenever the first stat is low the second stat is high, and whenever the second stat is low the first stat is high.
A correlation of “0” means there is no relationship between the two stats.
Given we want high stats to be offset by low stats, in general we want correlations to be negative (coloured as lighter colours in the figure below).
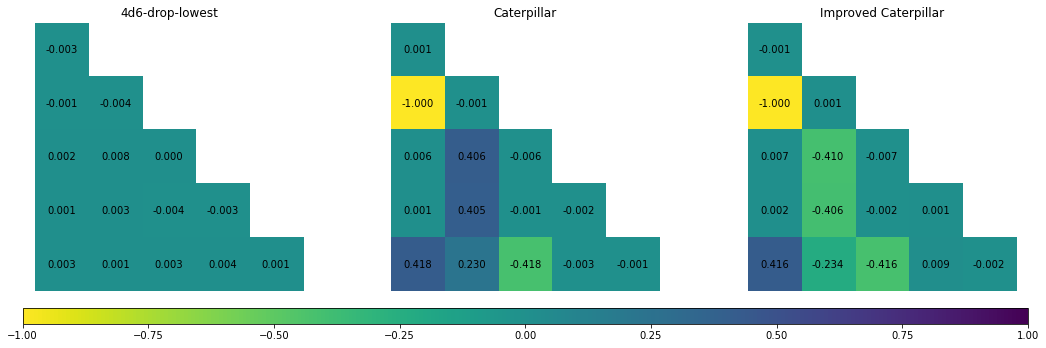
The correlation between stats in 4d6-drop-lowest is effectively 0. This makes sense, as there is no link between each of the six stats - they are all generated from separate die rolls.
The Caterpillar method has one correlations of -1 (recall that Stat 1 and Stat 3 are opposite sides of the same dice, so they will always total to 21). However, other stats have positive correlations: specifically the correlation between Stat 2 and Stats 4, 5 and 6. This is because each of these stats add the top faces of the dice to calculate their value, meaning when one of those stats is high, others will also tend to be high.
The Improved Caterpillar method has a much higher amount of negative correlation. This is consistent with what we’ve seen before: Improved Caterpillar means that characters will tend to not have very high or low stats across the board.
Summary
4d6-drop-lowest and Caterpillar produce a similar amount of variations between characters. This makes it less ideal as a stat generation technique. The Improved Caterpillar method achieves much less variation.
The next session considers even more alternatives for stat generation, and discusses their merits compared to the Improved Caterpillar.